


State Senate District 35, Pennsylvania
About
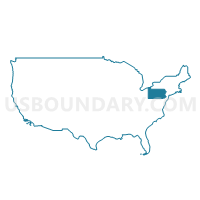
Outline

Summary
| Unique Area Identifier | 201299 |
| Name | State Senate District 35 |
| State | Pennsylvania |
| Area (square miles) | 2,287.21 |
| Land Area (square miles) | 2,268.58 |
| Water Area (square miles) | 18.63 |
| % of Land Area | 99.19 |
| % of Water Area | 0.81 |
| Latitude of the Internal Point | 40.91850960 |
| Longtitude of the Internal Point | -78.16105840 |
| Total Population | 232,251 |
| Total Housing Units | 107,194 |
| Total Households | 93,250 |
| Median Age | 42.8 |
Maps

Graphs
Select a template below for downloading or customizing gragh for State Senate District 35, Pennsylvania


Neighbors
Neighoring State Legislative District Upper Chamber (by Name) Neighboring State Legislative District Upper Chamber on the Map
- State Senate District 23, PA
- State Senate District 25, PA
- State Senate District 30, PA
- State Senate District 32, PA
- State Senate District 34, PA
- State Senate District 41, PA
Top 10 Neighboring County (by Population) Neighboring County on the Map
- Westmoreland County, PA (365,169)
- Centre County, PA (153,990)
- Cambria County, PA (143,679)
- Blair County, PA (127,089)
- Lycoming County, PA (116,111)
- Indiana County, PA (88,880)
- Clearfield County, PA (81,642)
- Somerset County, PA (77,742)
- Bedford County, PA (49,762)
- Union County, PA (44,947)
Top 10 Neighboring County Subdivision (by Population) Neighboring County Subdivision on the Map
- Johnstown city, Cambria County, PA (20,978)
- Richland township, Cambria County, PA (12,814)
- Logan township, Blair County, PA (12,289)
- Lock Haven city, Clinton County, PA (9,772)
- Lawrence township, Clearfield County, PA (7,681)
- Conemaugh township, Somerset County, PA (7,279)
- Allegheny township, Blair County, PA (6,738)
- Antis township, Blair County, PA (6,499)
- Cambria township, Cambria County, PA (6,099)
- Adams township, Cambria County, PA (5,972)
Top 10 Neighboring Place (by Population) Neighboring Place on the Map
- Johnstown city, PA (20,978)
- Lock Haven city, PA (9,772)
- Westmont borough, PA (5,181)
- Windber borough, PA (4,138)
- Northern Cambria borough, PA (3,835)
- Elim CDP, PA (3,727)
- Ebensburg borough, PA (3,351)
- Belmont CDP, PA (2,784)
- Philipsburg borough, PA (2,770)
- Nanty-Glo borough, PA (2,734)
Top 10 Neighboring Unified School District (by Population) Neighboring Unified School District on the Map
- Altoona Area School District, PA (59,612)
- Keystone Central School District, PA (37,799)
- Greater Johnstown School District, PA (27,676)
- Hollidaysburg Area School District, PA (27,019)
- Bellefonte Area School District, PA (25,328)
- Clearfield Area School District, PA (19,134)
- St. Marys Area School District, PA (18,979)
- Jersey Shore Area School District, PA (17,858)
- Penn Cambria School District, PA (17,381)
- Mifflinburg Area School District, PA (16,360)
Top 10 Neighboring State Legislative District Lower Chamber (by Population) Neighboring State Legislative District Lower Chamber on the Map
- State House District 77, PA (70,466)
- State House District 171, PA (67,294)
- State House District 85, PA (66,182)
- State House District 76, PA (63,384)
- State House District 80, PA (62,593)
- State House District 59, PA (61,834)
- State House District 78, PA (60,809)
- State House District 62, PA (60,760)
- State House District 81, PA (60,600)
- State House District 79, PA (59,270)
Top 10 Neighboring 111th Congressional District (by Population) Neighboring 111th Congressional District on the Map
- Congressional District 10, PA (669,257)
- Congressional District 9, PA (666,810)
- Congressional District 5, PA (651,762)
- Congressional District 12, PA (612,384)
Top 10 Neighboring Census Tract (by Population) Neighboring Census Tract on the Map
- Census Tract 307, Clinton County, PA (7,780)
- Census Tract 117, Lycoming County, PA (7,427)
- Census Tract 3308, Clearfield County, PA (7,025)
- Census Tract 3317, Clearfield County, PA (6,886)
- Census Tract 128, Cambria County, PA (6,722)
- Census Tract 3309, Clearfield County, PA (6,572)
- Census Tract 104.02, Blair County, PA (6,499)
- Census Tract 902, Union County, PA (6,452)
- Census Tract 125, Cambria County, PA (6,099)
- Census Tract 206, Somerset County, PA (6,094)
Top 10 Neighboring 5-Digit ZIP Code Tabulation Area (by Population) Neighboring 5-Digit ZIP Code Tabulation Area on the Map
- 16601, PA (33,870)
- 15905, PA (21,226)
- 17745, PA (19,063)
- 15904, PA (16,608)
- 16830, PA (13,695)
- 16686, PA (13,488)
- 17740, PA (12,754)
- 15902, PA (12,513)
- 16635, PA (11,321)
- 15906, PA (11,144)
Data
Demographic, Population, Households, and Housing Units
** Data sources from census 2010 **
Show Data on Map
Download Full List as CSV
Download Quick Sheet as CSV
| Subject | This Area | Pennsylvania | National |
|---|---|---|---|
| POPULATION | |||
| Total Population Map | 232,251 | 12,702,379 | 308,745,538 |
| POPULATION, HISPANIC OR LATINO ORIGIN | |||
| Not Hispanic or Latino Map | 228,132 | 11,982,719 | 258,267,944 |
| Hispanic or Latino Map | 4,119 | 719,660 | 50,477,594 |
| POPULATION, RACE | |||
| White alone Map | 219,432 | 10,406,288 | 223,553,265 |
| Black or African American alone Map | 7,518 | 1,377,689 | 38,929,319 |
| American Indian and Alaska Native alone Map | 250 | 26,843 | 2,932,248 |
| Asian alone Map | 1,095 | 349,088 | 14,674,252 |
| Native Hawaiian and Other Pacific Islander alone Map | 49 | 3,653 | 540,013 |
| Some Other Race alone Map | 1,371 | 300,983 | 19,107,368 |
| Two or More Races Map | 2,536 | 237,835 | 9,009,073 |
| POPULATION, SEX | |||
| Male Map | 116,356 | 6,190,363 | 151,781,326 |
| Female Map | 115,895 | 6,512,016 | 156,964,212 |
| POPULATION, AGE (18 YEARS) | |||
| 18 years and over Map | 186,701 | 9,910,224 | 234,564,071 |
| Under 18 years | 45,550 | 2,792,155 | 74,181,467 |
| POPULATION, AGE | |||
| Under 5 years | 11,748 | 729,538 | 20,201,362 |
| 5 to 9 years | 12,397 | 753,635 | 20,348,657 |
| 10 to 14 years | 12,937 | 791,151 | 20,677,194 |
| 15 to 17 years | 8,468 | 517,831 | 12,954,254 |
| 18 and 19 years | 7,419 | 387,235 | 9,086,089 |
| 20 years | 3,838 | 191,942 | 4,519,129 |
| 21 years | 3,605 | 183,257 | 4,354,294 |
| 22 to 24 years | 8,475 | 498,947 | 12,712,576 |
| 25 to 29 years | 12,545 | 781,527 | 21,101,849 |
| 30 to 34 years | 12,485 | 729,592 | 19,962,099 |
| 35 to 39 years | 13,916 | 764,287 | 20,179,642 |
| 40 to 44 years | 14,879 | 851,382 | 20,890,964 |
| 45 to 49 years | 16,737 | 955,763 | 22,708,591 |
| 50 to 54 years | 18,549 | 984,641 | 22,298,125 |
| 55 to 59 years | 17,273 | 879,048 | 19,664,805 |
| 60 and 61 years | 6,181 | 312,575 | 7,113,727 |
| 62 to 64 years | 8,511 | 430,721 | 9,704,197 |
| 65 and 66 years | 4,588 | 231,623 | 5,319,902 |
| 67 to 69 years | 6,658 | 321,379 | 7,115,361 |
| 70 to 74 years | 9,073 | 426,536 | 9,278,166 |
| 75 to 79 years | 7,904 | 362,332 | 7,317,795 |
| 80 to 84 years | 7,146 | 311,761 | 5,743,327 |
| 85 years and over | 6,919 | 305,676 | 5,493,433 |
| MEDIAN AGE BY SEX | |||
| Both sexes Map | 42.80 | 40.10 | 37.20 |
| Male Map | 41.10 | 38.70 | 35.80 |
| Female Map | 44.70 | 41.50 | 38.50 |
| HOUSEHOLDS | |||
| Total Households Map | 93,250 | 5,018,904 | 116,716,292 |
| HOUSEHOLDS, HOUSEHOLD TYPE | |||
| Family households: Map | 60,509 | 3,261,307 | 77,538,296 |
| Husband-wife family Map | 46,216 | 2,417,765 | 56,510,377 |
| Other family: Map | 14,293 | 843,542 | 21,027,919 |
| Male householder, no wife present Map | 4,454 | 229,495 | 5,777,570 |
| Female householder, no husband present Map | 9,839 | 614,047 | 15,250,349 |
| Nonfamily households: Map | 32,741 | 1,757,597 | 39,177,996 |
| Householder living alone Map | 27,836 | 1,433,415 | 31,204,909 |
| Householder not living alone Map | 4,905 | 324,182 | 7,973,087 |
| HOUSEHOLDS, HISPANIC OR LATINO ORIGIN OF HOUSEHOLDER | |||
| Not Hispanic or Latino householder: Map | 92,595 | 4,823,358 | 103,254,926 |
| Hispanic or Latino householder: Map | 655 | 195,546 | 13,461,366 |
| HOUSEHOLDS, RACE OF HOUSEHOLDER | |||
| Householder who is White alone | 90,518 | 4,264,337 | 89,754,352 |
| Householder who is Black or African American alone | 1,713 | 498,966 | 14,129,983 |
| Householder who is American Indian and Alaska Native alone | 86 | 9,573 | 939,707 |
| Householder who is Asian alone | 314 | 109,060 | 4,632,164 |
| Householder who is Native Hawaiian and Other Pacific Islander alone | 20 | 1,127 | 143,932 |
| Householder who is Some Other Race alone | 134 | 82,237 | 4,916,427 |
| Householder who is Two or More Races | 465 | 53,604 | 2,199,727 |
| HOUSEHOLDS, HOUSEHOLD TYPE BY HOUSEHOLD SIZE | |||
| Family households: Map | 60,509 | 3,261,307 | 77,538,296 |
| 2-person household Map | 29,786 | 1,442,819 | 31,882,616 |
| 3-person household Map | 13,888 | 767,169 | 17,765,829 |
| 4-person household Map | 10,482 | 620,755 | 15,214,075 |
| 5-person household Map | 4,283 | 271,611 | 7,411,997 |
| 6-person household Map | 1,388 | 98,268 | 3,026,278 |
| 7-or-more-person household Map | 682 | 60,685 | 2,237,501 |
| Nonfamily households: Map | 32,741 | 1,757,597 | 39,177,996 |
| 1-person household Map | 27,836 | 1,433,415 | 31,204,909 |
| 2-person household Map | 4,076 | 262,684 | 6,360,012 |
| 3-person household Map | 515 | 36,955 | 992,156 |
| 4-person household Map | 235 | 16,687 | 411,171 |
| 5-person household Map | 54 | 4,799 | 126,634 |
| 6-person household Map | 14 | 1,720 | 48,421 |
| 7-or-more-person household Map | 11 | 1,337 | 34,693 |
| HOUSING UNITS | |||
| Total Housing Units Map | 107,194 | 5,567,315 | 131,704,730 |
| HOUSING UNITS, OCCUPANCY STATUS | |||
| Occupied Map | 93,250 | 5,018,904 | 116,716,292 |
| Vacant Map | 13,944 | 548,411 | 14,988,438 |
| HOUSING UNITS, OCCUPIED, TENURE | |||
| Owned with a mortgage or a loan Map | 36,095 | 2,268,674 | 52,979,430 |
| Owned free and clear Map | 33,095 | 1,223,048 | 23,006,644 |
| Renter occupied Map | 24,060 | 1,527,182 | 40,730,218 |
| HOUSING UNITS, VACANT, VACANCY STATUS | |||
| For rent Map | 2,118 | 135,262 | 4,137,567 |
| Rented, not occupied Map | 198 | 9,386 | 206,825 |
| For sale only Map | 1,285 | 64,818 | 1,896,796 |
| Sold, not occupied Map | 521 | 20,131 | 421,032 |
| For seasonal, recreational, or occasional use Map | 5,391 | 161,582 | 4,649,298 |
| For migrant workers Map | 6 | 411 | 24,161 |
| Other vacant Map | 4,425 | 156,821 | 3,652,759 |
| HOUSING UNITS, OCCUPIED, AVERAGE HOUSEHOLD SIZE BY TENURE | |||
| Total: Map | 2.33 | 2.45 | 2.58 |
| Owner occupied Map | 2.44 | 2.57 | 2.65 |
| Renter occupied Map | 2.01 | 2.16 | 2.44 |
| HOUSING UNITS, OCCUPIED, TENURE BY RACE OF HOUSEHOLDER | |||
| Owner occupied: Map | 69,190 | 3,491,722 | 75,986,074 |
| Householder who is White alone Map | 68,171 | 3,140,005 | 63,446,275 |
| Householder who is Black or African American alone Map | 529 | 228,851 | 6,261,464 |
| Householder who is American Indian and Alaska Native alone Map | 44 | 4,562 | 509,588 |
| Householder who is Asian alone Map | 162 | 62,204 | 2,688,861 |
| Householder who is Native Hawaiian and Other Pacific Islander alone Map | 13 | 544 | 61,911 |
| Householder who is Some Other Race alone Map | 45 | 30,761 | 1,975,817 |
| Householder who is Two or More Races Map | 226 | 24,795 | 1,042,158 |
| Renter occupied: Map | 24,060 | 1,527,182 | 40,730,218 |
| Householder who is White alone Map | 22,347 | 1,124,332 | 26,308,077 |
| Householder who is Black or African American alone Map | 1,184 | 270,115 | 7,868,519 |
| Householder who is American Indian and Alaska Native alone Map | 42 | 5,011 | 430,119 |
| Householder who is Asian alone Map | 152 | 46,856 | 1,943,303 |
| Householder who is Native Hawaiian and Other Pacific Islander alone Map | 7 | 583 | 82,021 |
| Householder who is Some Other Race alone Map | 89 | 51,476 | 2,940,610 |
| Householder who is Two or More Races Map | 239 | 28,809 | 1,157,569 |
| HOUSING UNITS, OCCUPIED, TENURE BY HISPANIC OR LATINO ORIGIN OF HOUSEHOLDER | |||
| Owner occupied: Map | 69,190 | 3,491,722 | 75,986,074 |
| Not Hispanic or Latino householder Map | 68,889 | 3,408,824 | 69,617,625 |
| Hispanic or Latino householder Map | 301 | 82,898 | 6,368,449 |
| Renter occupied: Map | 24,060 | 1,527,182 | 40,730,218 |
| Not Hispanic or Latino householder Map | 23,706 | 1,414,534 | 33,637,301 |
| Hispanic or Latino householder Map | 354 | 112,648 | 7,092,917 |
| HOUSING UNITS, OCCUPIED, TENURE BY HOUSEHOLD SIZE | |||
| Owner occupied: Map | 69,190 | 3,491,722 | 75,986,074 |
| 1-person household Map | 16,364 | 767,169 | 16,453,569 |
| 2-person household Map | 27,672 | 1,304,206 | 27,618,605 |
| 3-person household Map | 11,309 | 596,731 | 12,517,563 |
| 4-person household Map | 8,727 | 499,363 | 10,998,793 |
| 5-person household Map | 3,517 | 210,370 | 5,057,765 |
| 6-person household Map | 1,054 | 72,113 | 1,965,796 |
| 7-or-more-person household Map | 547 | 41,770 | 1,373,983 |
| Renter occupied: Map | 24,060 | 1,527,182 | 40,730,218 |
| 1-person household Map | 11,472 | 666,246 | 14,751,340 |
| 2-person household Map | 6,190 | 401,297 | 10,624,023 |
| 3-person household Map | 3,094 | 207,393 | 6,240,422 |
| 4-person household Map | 1,990 | 138,079 | 4,626,453 |
| 5-person household Map | 820 | 66,040 | 2,480,866 |
| 6-person household Map | 348 | 27,875 | 1,108,903 |
| 7-or-more-person household Map | 146 | 20,252 | 898,211 |
Loading...